
Available in Enterprise
EARLY ACCESS: If you're interested in using this feature and you're on the Enterprise plan, please reach out to your success manager, who will activate this for you.
---
The Group Dashboard is the central place for monitoring and analyzing the key metrics related to your country or brand's performance.
In this article:
Accessing the group analytics dashboard
To access the group dashboard, navigate to the Dashboard link under the Group menu (•••).

High-level success metrics
High-level metrics at the top of the dashboard offer a quick snapshot of how your country or brand has performed. These metrics reflect the data based on applied filters, such as date range, collections (if applicable), and devices readers use to access your publications.
Key metrics:
- Opens. Total number of times your publications were opened. If a publication is refreshed, a new open is recorded.
- Page views. Total number of page views across all publications.
- Average engagement. The average time readers spend engaging with your content.
- Product views. The total number of views on products showcased in your publications.
- Clickthrough rate. The total number of link clicks divided by the total number of publication opens.
- Opens (Line graph). A visual representation of the number of publications opened over a specified period.
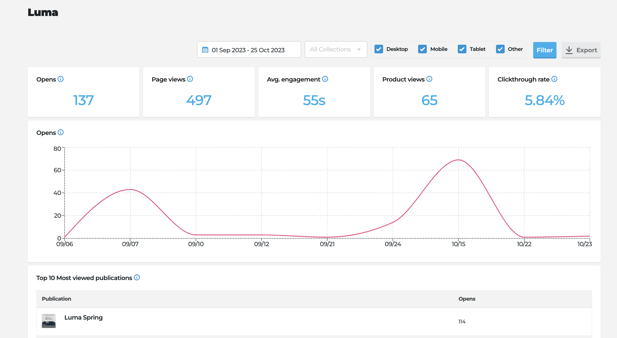
Top 10 Most viewed Publications
This section lets you gain insights into the publications that received the most attention. The table presents the top 10 performing publications, sorted from the most to the least opened, based on the filters applied (date range, collections, and devices). This information provides valuable visibility into the content that resonates most with your audience within the group.
Note: if you are looking for a more detailed publication performance overview within the group based on various content performance and engagement metrics (e.g. page views, CTR, bounce rate), you should use the data export functionality.
Data export
The data export feature enhances your analytical capabilities by allowing you to download detailed reports in PDF or CSV formats.
First, select the date range, collections (if applicable), and device filter values - these criteria will be reflected in the exported data. The export button is located on the top right corner of the dashboard, next to the mentioned filters.

The PDF export is a snapshot without the interactivity of what you see on the dashboard.
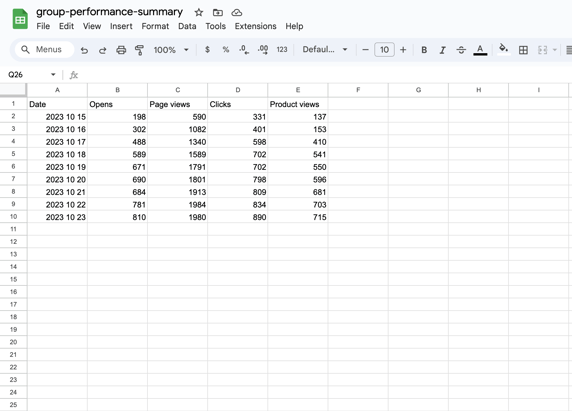
The CSV exported files include:
1. Overall performance summary of the group
Total opens, page views, link clicks, and product views presented by date. This format facilitates seamless compatibility with various databases and enables you to perform additional calculations like sums and averages.
2. Publication performance overview by various metrics
This table offers a granular view of how each publication within a group has performed so you can compare them. The following metrics are included:
- Publication title
- Online at - the dates when the publication was online
- Number of pages - length of the publication to be used as a quick reference for average pages viewed
- Opens
- Page views
- Average pages viewed - page views divided by number of pages
- Average engagement
- Bounce rate
- Clickthrough rate
- Product views
- Clicks

This export feature empowers you to conduct in-depth analyses and make informed decisions based on the detailed performance metrics of your country or brand.
Automated email reports
You can subscribe to receive a monthly email report of your group's performance. This way, it can remain front of mind, and you can forward it to your colleagues who don't have a Publitas account.
At the start of each month, you will get a PDF report per group you subscribed to for the previous month. From there, you can enter your account and dive deeper into the analysis via CSV export or on the publication level.
How to enable it?
- Go to each Group dashboard you wish to subscribe to, and on the '...' choose: 'Set up reporting'

- Switch the toggle 'Enable monthly report' to and 'Save & Update Reporting'. At the start of the next month, you'll have an email in your inbox!

Comparing publication performance
Interested in seeing how this year's Christmas season campaign did to last year? Or how is the weekly brochure compared to last week's? Or even how the same piece of content was used in two different markets over the same period? Read more here about comparing one publication's performance with another or two others.

Benchmark publication performance
Consider how you are performing compared to your competitors - read about our benchmarks here.