
⚠️ Universal Analytics no longer processes data for standard GA accounts.
For GA360 accounts, data will stop processing on July 1, 2024.
Make sure you connect your publications to GA4 to avoid losing data.
--
Using Google Analytics to learn more about your online publications can be a daunting task if you're unfamiliar with its complex interface and the overwhelming number of options. In this article, we list the most important reports, explain the metrics and suggest conclusions you may want to draw from your data to improve the performance of your publications.
Use the links below to quickly jump to a specific report:
- Audience overview report: Reach and engagement
- Mobile devices report: What devices are used
- Content drill-down report: Performance of individual pages
- Top events report: Number of links clicked and more
- Segments: Filter and compare specific publications
Numbers become meaningful if you understand how to action them.
Before you continue reading this article
You must first set up custom dimensions in Google Analytics to achieve the results described below. If you haven't configured custom dimensions yet, please be sure to check out Setting up Google Analytics. If you manage the Google Analytics connection via Google Tag Manager, click here.
As an Enterprise customer, you can also access our consultative services if you require additional support.
Audience overview report
Audience > Overview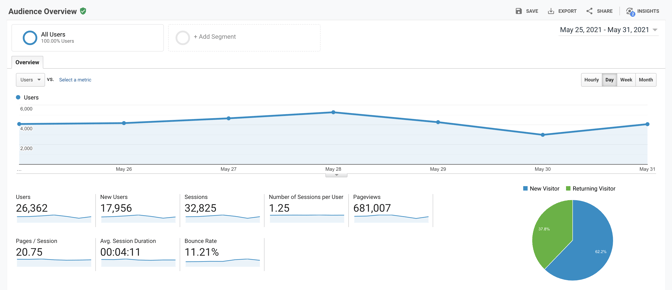
The Audience overview provides a great place to start. It shows you how many users have found and read your publications. It also contains several metrics indicating how these users engage with your content.
Understanding the metrics:
- Users vs. New Users = Users are visitors who have initiated at least one session within a specified period. New users have not visited your publications before, whereas returning users did (click here for more information).
- Sessions = Each time a user loads a publication, a session starts. During the session, pageviews, events, and other metrics are recorded. The session ends when the user remains inactive for 30 minutes or at midnight. If a user views two of your publications with less than half an hour in between, both can be recorded as a single session.
- Number of Sessions per User = This metric can be used to gauge the returning behavior of users.
- Pageviews = Each time a user navigates to a different page of the publication, views or closes content in the popup window (e.g., Product and Video hotspots), a pageview is registered.
- Pages / Session = The number of pageviews per session can be used to indicate how users engage with your content. Due to the different kinds of pageviews recorded during a session, there isn't much to learn from the number itself. However, you can see trends going up or down when your content becomes more engaging or increases in size.
- Avg. Session Duration = Another helpful metric to gauge user engagement. The longer they stay, the more intriguing your content must be. The duration mainly depends on the publication size, but it can also be influenced by the number and length of videos you add.
- Bounce Rate = A session bounces when a user closes the publication without interacting with any of its content. The percentage of the sessions that bounce is called the bounce rate.
TIP: Use Segments to find the results for a single publication. If you activate multiple segments, one per publication, you can even compare different publications against each other.
Mobile devices report
Audience > Mobile > Overview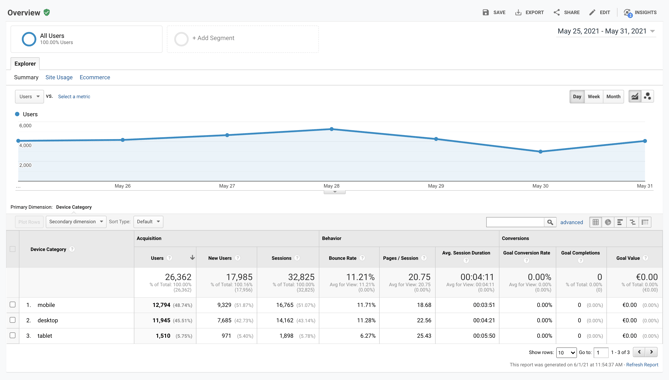
Ask yourself questions like:
- What is the primary device type readers use?
- How has that changed in the last few years?
- Are there significant differences in bounce rates between devices?
- Are there significant differences in conversions between devices?
What conclusions might you draw from this data?
If most readers view your publications on a small touch display, like a mobile phone, consider if your design is suited to small screens: Are there too many products on a page, and is the text readable?
TIP: Select either Operation system as the Secondary dimension to see what kind of devices are used (Android/iOS or Windows/Mac).
Content drill-down report
Behavior > Site content > Content Drilldown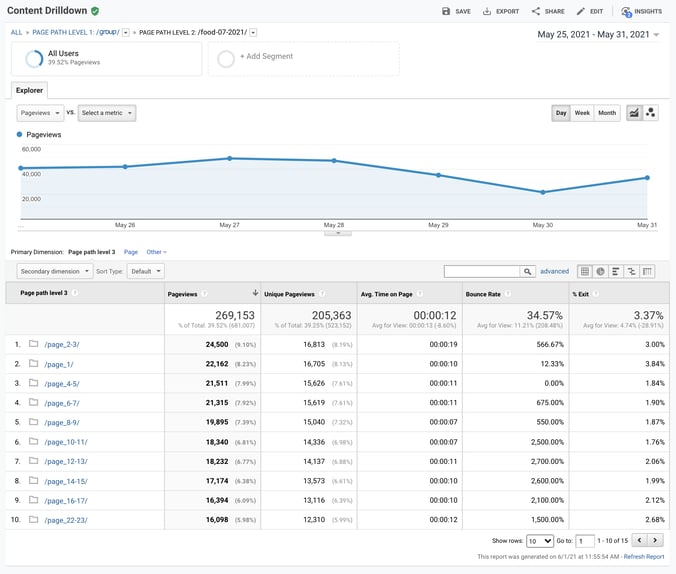
These are the different levels, in order, that can be explored:
Group > Publication > Page # > Product #
|
Using Google Tag Manager to configure tracking? Group > Publication > page/product > # |
- Pageviews = Each time a user navigates to a different page of the publication, views or closes content in the popup window (e.g. Product and Video hotspots), a pageview is registered
- Unique Pageviews = Where the number of pageviews keeps growing, even if users return to the content they've already seen, unique pageviews are only registered once for each user. Unique pageviews can help you understand how much of the available content is viewed.
- Avg. Time on Page = Reports how long pages or spreads have been viewed on average.
- Bounce Rate = This metric is irrelevant in this report.
- % Exit = When users leave the publication, the final page they were viewing is marked as the exit page. As such, you'd ideally want the page at the end of your publication to have the highest exit rate.
TIP: If you publish booklet publications, please note that each spread (e.g., pages 2-3) counts as a single pageview in Google Analytics. For example, an 18-page booklet catalog offers ten unique pageviews (product views not included): a cover page, a back page, and eight spreads.
When you're at page path level 4 and looking into the product-specific views, select the custom dimension Publitas - Product as the Secondary dimension to add product titles to the report:
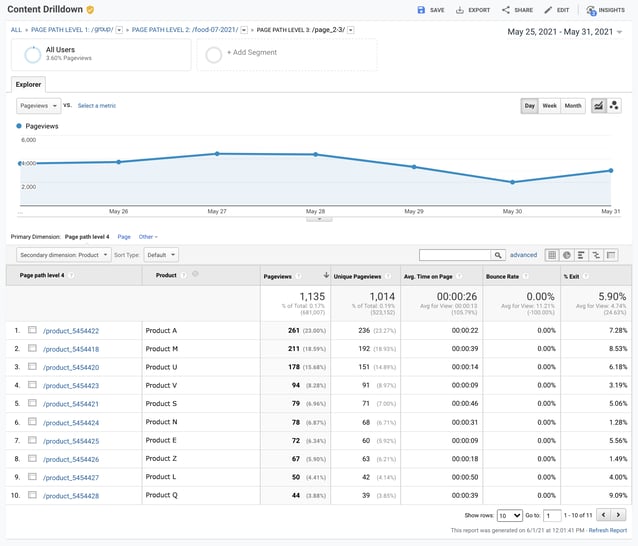
Alternatively, you can also select Page Title as the secondary dimension.
Top events report
Behavior > Events > Top Events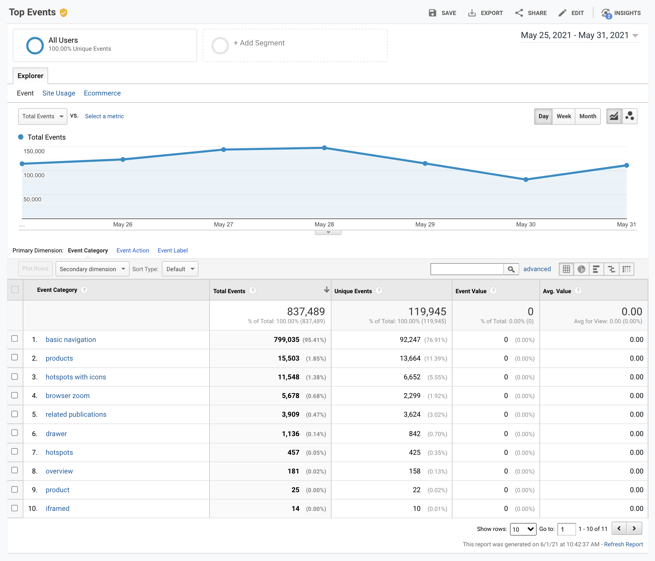
This report is particularly useful to find out what links have been clicked in the online publications. Link events are stored under different categories. Below is an overview of where you can find each link event:
|
|
Event Category | Event Action | Event Label |
|
Link hotspots: |
hotspot (with icons) | external links | URL |
|
Product cta button: |
products | call to action | URL |
|
Home button: |
basic navigation | home button | URL |
| Banner: | banner | external_link | click |
When looking at the content users interact most with, ask yourself questions like:
- Are readers responding better to certain types of content than others?
- Where are the most viewed pieces of content placed in the publication?
TIP: In a custom report or dashboard, you can easily filter the link clicks using the custom dimension 'Publitas - Link'. Add the custom dimension 'Publitas - Page' as a Secondary dimension to see what page each reported link was found on.
What conclusions might you draw from this data?
- If mobile users aren't clicking on interactive elements, are they seeing that they are clickable? By using hotspot icons users can quickly identify what elements on a page are interactive.
- Consider doing additional promotions for products that have shown to be popular on other channels.
Other useful resources:
|
Using Google Tag Manager to configure tracking? To find the links clicked, select the event category - link hotspot If you click on one of the event actions, you'll |
Segments
Filter and compare specific publications
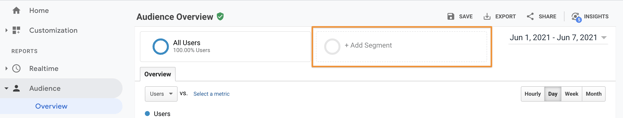
When generating reports in Google Analytics, you might want to see statistics for a single publication rather than all your publications combined. Using segments, you can filter the statistics of a single publication and even activate multiple segments to compare the performance of different publications.
- Select Add Segment
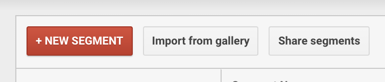
- Then, click on NEW SEGMENT
- Add the name of your publication as the segment name and go to the tab Advanced -> Conditions
- Select the custom dimension for Publitas - Publications as the dimension to filter the data on and have it exactly match the name of the publication:
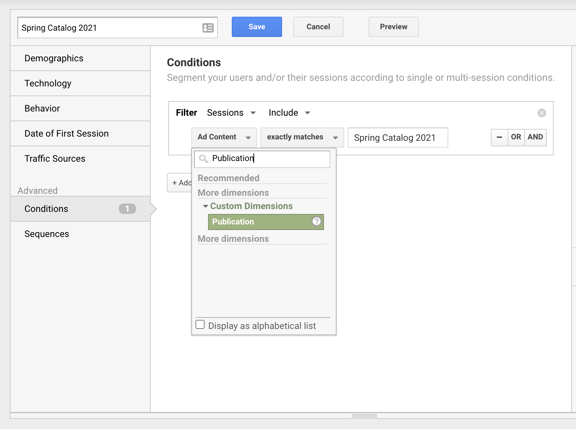
- Use the summary on the right side of the screen to see if the selected filter produces any results.
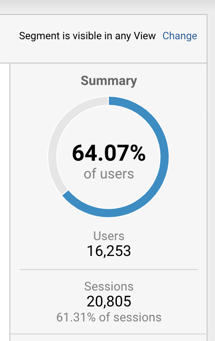
If the summary shows zero results, it either means no such data has been collected in the selected date range, or the filter is configured correctly. In that case, make sure to use the applicable date range, and the filter uses the publication name that exactly matches the one found in Publitas. - Finish creating the segment by clicking Save. The new segment should now also be active.
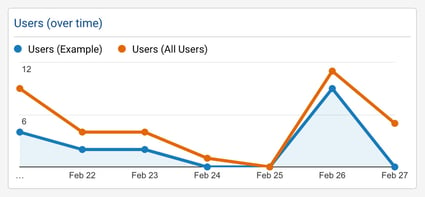
Each segment remains available for future use. By enabling multiple segments, your reports will show data for each of them using a different color. This is very useful to compare the performance of various publications.
TIP: You can also use segments to compare the performance per device. In step 4, simply apply the filter Device Category > exactly matched > mobile. Then create a second segment using the filter Device Category > exactly matched > desktop.