
⚠️ Universal Analytics no longer processes data for standard GA accounts.
For GA360 accounts, data will stop processing on July 1, 2024.
Make sure you connect your publications to GA4 to avoid losing data.
--
Understanding how shoppers use your online catalogs can be difficult, and the default reports in Google Analytics (GA) don't always give you the statistics you need. In this article, we’ll explain how you can set up GA to retrieve useful statistics for your catalogs with a custom dashboard that we have designed to include the most important key performance indicators (KPIs).
Note: The dashboard and instructions below work exclusively for the Google Analytics integration.
The Google Analytics integration allows you to track statistics like visits, pageviews, product views, page navigation, shares on social media, hotspot interaction, call-to-action clicks, traffic sources, and referrals.
And while we track much more than that, we’ve noticed that many of our customers prefer a simple-to-use dashboard that only provides the most relevant data. Let’s see how we can set that up.
Adding a ready-to-use Publitas dashboard to your Google Analytics account
With GA, custom dashboards are easy to create. And even better, dashboard configurations are shareable amongst users. So, we’ve created a custom dashboard with the most commonly requested catalog statistics and KPIs.
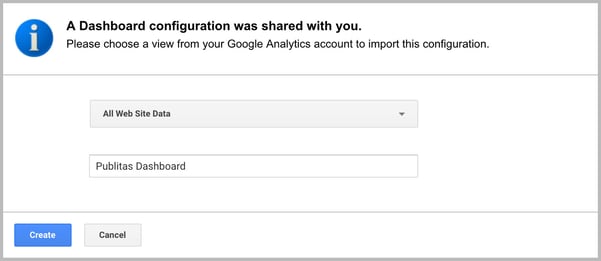
>> Click here to add the dashboard to your GA account <<
Select the view where you track your catalogs. The dashboard works for any catalogs published with Publitas and needs no further implementation.
You can find your newly added dashboard in GA under Customization -> Dashboards. Note that no data will be shared with you or others. You’re only importing the dashboard configuration, which then uses the data from your catalogs.
What does the custom dashboard report?
- Sessions (total): # of times your publication(s) have been viewed;
- Sessions with Link Clicks (CTR): # of sessions with at least one click on a link hotspot (or a link inside a product hotspot);
- Bounce Rate: % of sessions that close the publication right after they have just opened it;
- Source / Medium: # of sessions and their average duration for the top five sources of traffic;
- Sessions by Device Category: # of sessions, divided into three categories: desktop, mobile, and tablet;
- Avg. Session Duration: Average duration of a session;
- Pages/Spreads per Session: Average # of pages or spreads viewed per session. (Pages for single page view, and spreads for booklet view);
- Products Views (hotspots): Total # of product hotspot clicks;
- Most Viewed Products: # of clicks for the top 5 most clicked product hotspots;
- Links Clicked: Total # of link clicks, including link hotspots and links inside a product hotspot;
- Most Clicked Links (PRODUCT hotspots): # of clicks to your online store for the top 5 most clicked links inside product hotspots;
- Most Clicked Links (LINK hotspots): # of clicks for the top 5 most clicked link hotspots.
Using segments to view statistics for a single catalog
Sometimes, you might want to see statistics for a single catalog rather than all your catalogs combined. For example, if you wish to understand how a specific catalog or campaign is performing.
Click here to learn more about tracking specific catalogs in Google Analytics.