
Anytime someone visits and interacts with an online publication or the Publitas platform, data traffic is generated. How much traffic is generated per session depends on the degree the content is interacted with.
Among others, the following metrics have an impact on how much data traffic is generated.
- Publication-opens
- Pageviews
- Zoom interactions
- PDF downloads
- Hotspot clicks
- Screen resolution
Page size and Image resolution
When you upload a PDF to Publitas, each page gets converted into a set of images. For each page, images are stored in different resolutions, which are optimized for online use.
The size of each image is based on the dimensions of the pages in the PDF. For example, Tabloid pages at 11" by 17" will contain finer detail than Letter pages at 8.5" by 11", specifically when displayed on the same digital screen. To ensure the finer detail doesn't appear blurry or pixelated, larger images will be used.
The resolution which will load to display a page depends on the resolution of the screen the publication is loaded on. Logically, when a publication is viewed in a full-size browser loaded on a 2880x1440 pixel display, higher resolution images are required for the pages to appear clear and sharp. Another scenario in which higher-resolution images are used is when a visitor zooms in on a page. By loading the resolution based on what is demanded by the hardware, we ensure traffic is only generated when it's required.
The PDF you upload to Publitas can also contribute to data traffic being generated. The PDF that can be downloaded from the publication's menu is an almost exact copy of the PDF that was originally uploaded to Publitas. So, if you have the PDF download option enabled, you can avoid generating a lot of MBs at a single click by optimizing the PDF before uploading it to Publitas, retaining as much image resolution (>180DPI) and image quality as possible.
Monthly traffic reports
If you're the account admin, you can find an overview of the traffic that has been generated on a monthly basis by clicking on your initials in the top-right corner and selecting "Manage account" (or log in and click here).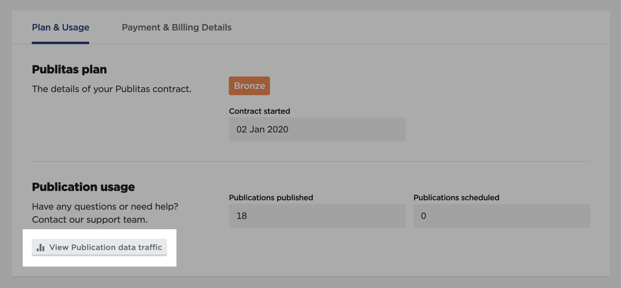
In the Chrome browser, you can also see how much data is loaded when viewing and interacting with a publication:
- Load a new tab in Chrome;
- Use the shortcut Shift + CTRL + J (on Windows/Linux) or Option + ⌘ + J (on macOS) to open the console;
- Click on the Network tab;
- Open a publication.
At the very bottom of the Network tab, you'll find the amount of data that is being loaded while you interact with the publication:![]()
Of course, every visitor will interact with the content differently so this is mainly a tool to get a better understanding of how data traffic is generated and the possible impact that certain features can have on the data traffic.